New York City
NYC launches website to highlight social equity outcomes
New data shows the city’s race and gender gaps on health, economic and educational indicators.
Screenshot from the new EquityNYC website. EquityNYC


It’s no secret that in New York City, like much of the country, Black and Latino people suffer from worse health outcomes than white people, or that women are less likely to participate in the labor force than men. These kinds of gaps in equitable access to health care, education, employment and more have only become more apparent and pronounced during the coronavirus pandemic.
Now, a new city resource promises to make it easier than ever to observe just how pervasive some of those gaps are, with the eventual goal of eradicating those disparities. On Tuesday, the city launched EquityNYC, a website that pulls together data on social equity outcomes – in areas including health, education and economic security – with the data broken down by factors such as race, gender and income.
The EquityNYC website highlights new data – the most recent of it through 2019 – that was collected this past summer and includes statistics on 45 equity outcome indicators that are required to be collected every year in the city’s Social Indicators and Equity Report. This year, for the first time, that data is accessible not just in a written report, but in easy to read charts online. “Obviously, as we’re working on equity, we also need to be thinking about accessibility,” said Sara Shoener, special policy adviser in the Mayor’s Office for Economic Opportunity. “So we always had user experience, making this digital, making this more interactive and easier for a nondata fluent audience to use in the back of our heads. And finally we’re able to launch it now.”
In addition to measuring those 45 more general metrics – such as infant mortality rate and high school graduation rates – the website also incorporates data on 65 different performance metrics from city agencies and services. Some of these metrics include breakdowns on recipients of child care vouchers or participants in the city’s Summer Youth Employment Program. The website pulls from over 25 different city agencies and information from independent sources – such as the New York University Furman Center, a housing research institute – are cited in some graphs as well.
The range of data available varies depending on the equity indicator. Only two years of data for broadband internet access are available: 2017 and 2018. But the areas that do include new data from 2019 offer some interesting insights.
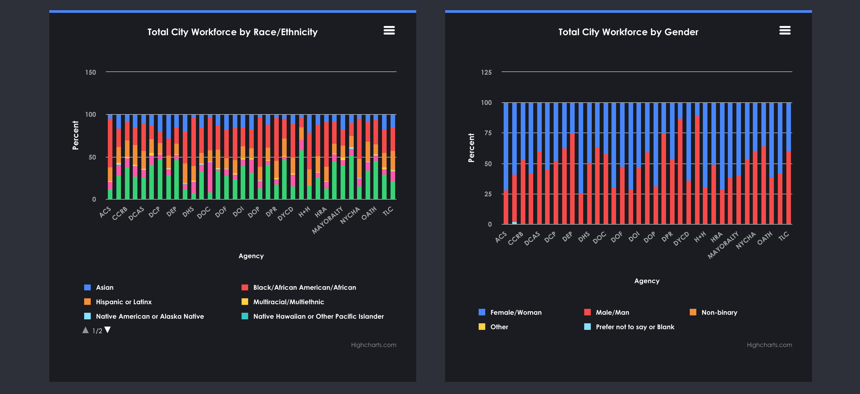
One metric measures diversity within city agencies themselves – broken down by race, ethnicity and gender, as of fiscal year 2019. While racial diversity within the city government’s workforce appears relatively strong, breakdowns by agency show variance. The Fire Department, for example, had the highest share of white members and among the lowest share of women. The share of Black employees was the highest in the city Department of Probation, where over 58% of employees identified as Black, African American or African.
And while overall diversity in city agencies may be relatively good, clear gaps in leadership are apparent. The 35 city agencies whose workforce data is included on the site overwhelmingly have white people in leadership positions. Exceptions include the Administration for Children’s Services and the New York City Housing Authority, where the majority of employees in management positions identified as Black or Latino.
Other metrics highlight disparities in the contracts that different city agencies award to minority- and women-owned business enterprises (or MWBEs). In fiscal year 2019, the New York City Commission on Human Rights awarded over 88% of its total prime contract awards to MWBEs, while the Department of Transportation awarded just over 5% to MWBEs.
EquityNYC is a product of Executive Order 45, an order Mayor Bill de Blasio signed in 2019 that mandated the continuation and expansion of the Social Indicators and Equity Report, requiring the Office for Economic Opportunity to identify new metrics and data sources that could be incorporated into the report, disaggregated by race, gender, income and more. In addition to showcasing this data, the website links to city policies and programs relevant to each of the eight policy domains – which include core infrastructure and environment, economic security and mobility, and housing. “Racial and social equity is integral to creating a fairer city that works for all New Yorkers,” Sideya Sherman, executive director of the city’s Taskforce on Racial Inclusion and Equity, said in a statement. “Equity NYC helps us better understand the magnitude of disparities and progress, so we can work collectively to shift policies and practices and develop strategies that get results.”
As Shoener sees it, EquityNYC has two audiences: the decision-makers who are creating those very policies and programs, and city residents who can use this data to learn about how the city is working and advocate for additional action. (Those who may not be able to benefit from the site include New Yorkers without broadband access – or roughly 30% percent of city households, as one of the site’s metrics tells us.)
Color-coded, downloadable and relatively detailed charts make the data displayed on EquityNYC somewhat easy to observe. But New York City hasn’t always had a strong track record with making easy to use digital products. Most recently, the city’s vaccination sign-up websites have been slammed for not only being inaccessible and glitchy, but for their subpar design and user experience. And while the city keeps troves of public data accessible through its Open Data portal, those datasets are not always easy to read or analyze for people who aren’t data scientists.
Shoener said that the conception of the EquityNYC site happened within the Mayor’s Office for Economic Opportunity, with the help of its Service Design Studio in thinking about the user experience, branding and scope of the website. Other parts of the office were brought in, including the tech and product team, and the data enterprise team, which has been responsible for building the data infrastructure for the site and answering data storage and privacy questions. Policy folks such as Shoener were tasked with thinking about the site’s content, including figuring out what kinds of additional outcome and performance metrics would be incorporated in the site. Finally, the office outsourced the actual building and coding of the site to the vendor Blenderbox.
What EquityNYC doesn’t yet show is the profound impact the COVID-19 pandemic is likely to have on many of these indicators, because the most recent data only goes through 2019. But the Office for Economic Opportunity is already anticipating the impact of the pandemic and expanding what kind of data is collected and analyzed on the site in the months and years to come. One addition that could be coming next year is geographic analysis. “We’re going to be doing a lot of mapping, and we’re talking a lot with the infrastructure agencies about how to think about where the city is investing and where we’re seeing disproportionate outcomes,” Shoener said.